
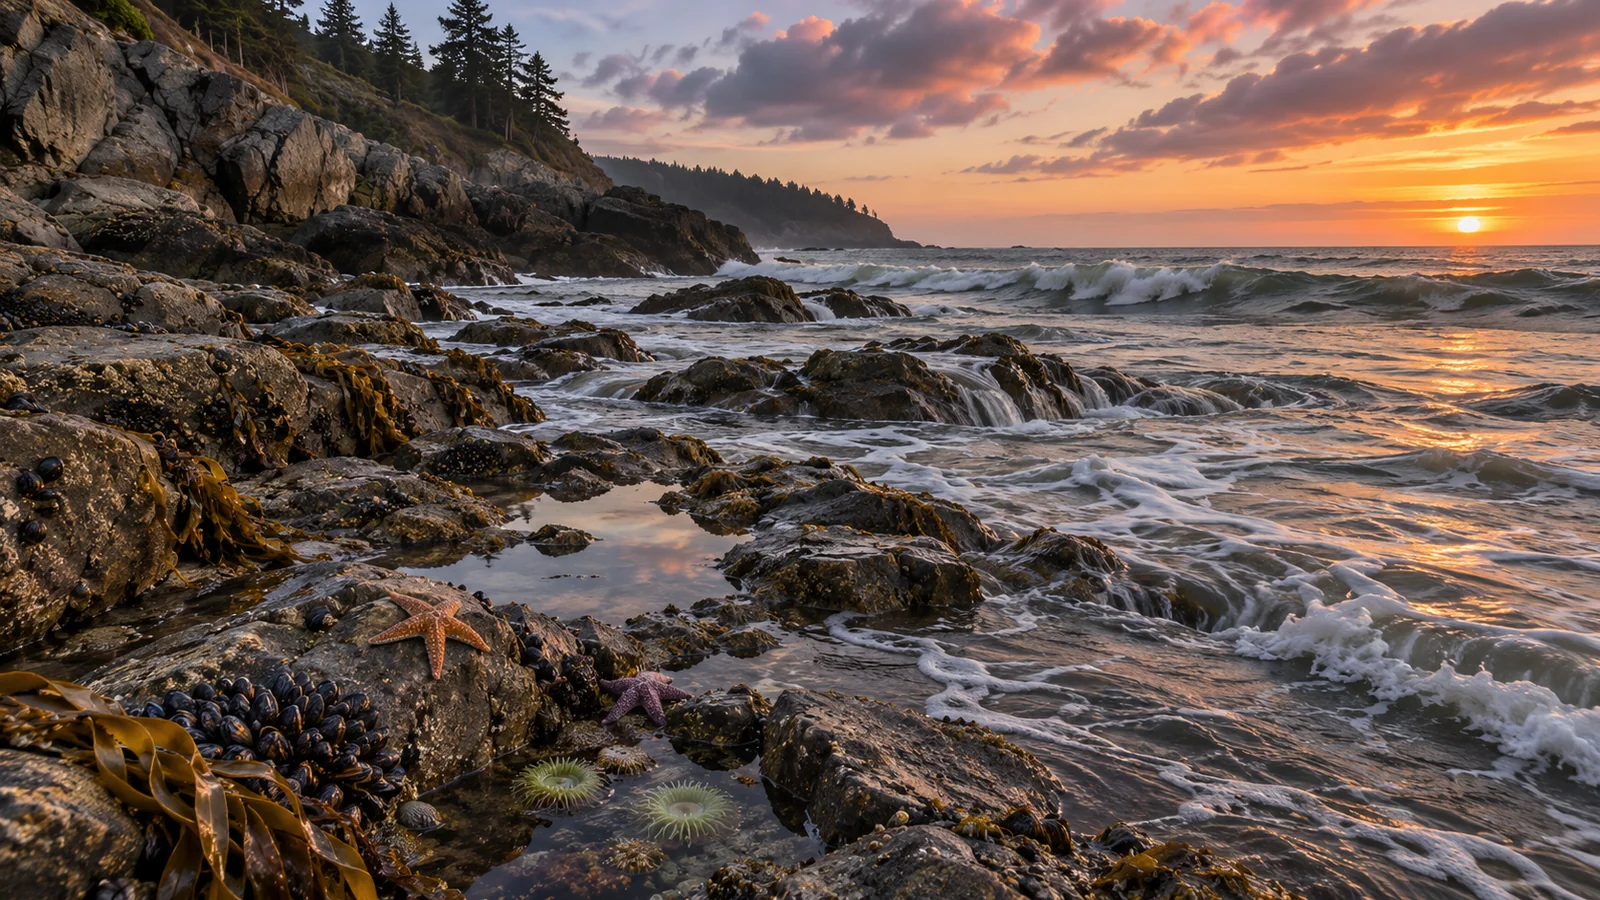
Use the Canadian Hydrographic Service tide predictions for Campbell River station 08074 to find when the water is expected to be high or low and how high it will be relative to chart datum. Check the station, date, time zone and units before copying anything into your plans. If you want to know how fast water is expected to move through Seymour Narrows, open the separate current predictions for that location. Tide height measures a vertical change, while a current table describes the movement of water. Keeping those questions separate makes it easier to plan a shoreline stop, understand what you see in Discovery Passage or discuss conditions with a tour crew. Campbell River tide predictions · Seymour Narrows current predictions
Start with the station and the date
Choose the Campbell River station when you want a prediction for its location. The number 08074 helps distinguish it from other stations, including ones listed nearby in Discovery Passage. Check your destination against the map or station information. A result for Campbell River is a useful reference for the city waterfront, but it describes the prediction at the station. If your plan takes you farther away, use the official station list and appropriate guidance for that location. Canadian Hydrographic Service Campbell River station
Select the date you will actually be near the water. If you are planning across midnight or looking at a downloaded table, keep the date beside the time. A prediction just after midnight belongs to the new calendar day. It is easy to carry the wrong low tide into a morning plan if you copy a line without its date. Use the time zone indicated on the source, then compare it with the time shown on the device or schedule you will use that day.
The Campbell River station page identifies its time zone as Canada/Pacific. Check the label on whichever web table, chart or printed edition you are reading and follow its time convention. A phone that is still showing the time from another region can make the right prediction look like the wrong hour. Write the local time with the date and station if you are sharing the plan with a companion.
Read the high and low water entries as a sequence
A high water entry gives a predicted time when the water level reaches a local maximum at that station. A low water entry gives a predicted local minimum. Look at the entries before and after the part of the day you plan to be outside. One low followed by a high tells you the predicted overall direction of change between them. The height and time of the next entry help put the rate and extent of that change into context.
One low may be higher or lower than another on the same day. If your purpose is to see more of a beach, compare the heights as well as the times. A low at a convenient hour may expose a different amount of shore from another low on the table. How much ground you actually see also depends on the slope and shape of the shoreline. A slight vertical change can uncover more space on a gently sloped beach than on a steep bank.
The water generally changes between the published high and low points. A chart can show the shape of that change or provide a prediction for intermediate times. Use the graph if you need to know what the water might be doing before you arrive or while you are leaving. Dividing the height difference by the number of hours gives a rough average, but the water can rise or fall at different rates during that period.
Understand what the height measures
The station reports heights relative to chart datum, a reference level used in charts and tide predictions. A predicted height of one metre, for example, means one metre above that reference. It does not mean that the water is one metre deep at the point where you are standing. Local depth depends on the shape of the bottom and where that bottom sits relative to the same reference.
If you are looking at a chart, check its units and reference before comparing numbers. The difference between two heights in the same table is useful for describing the predicted vertical change. Whether that much water reaches a particular rock, step or patch of shore depends on its elevation and local conditions. The tide table helps you pick a time to look. It does not tell you which rocks are dry or whether the footing will be suitable when you arrive.
A shoreline example can help. If the table shows a low at 10 a.m. and a higher level later, a visit around that low may give you a better view of exposed shore. These are example times, so open the actual station for your date. Plan where you will stand or walk, and leave enough room to retreat to higher ground if water reaches farther than you expected. Use what you see at the site to adjust the plan.
Distinguish predictions from conditions at the waterfront
The table describes expected water levels. Wind, atmospheric conditions and other local factors can change what the water actually does, and waves can reach above the surface level represented by the prediction. Look at the forecast and the shore before deciding whether to walk down from a park or stay on the path. A beach can be uncomfortable or unsuitable in rough water even when the predicted tide is low.
At a viewpoint, compare where water is reaching now with a fixed feature. Watch several sets of waves before using one dry moment as a guide. If a lower part of the shoreline depends on a narrow exit, be especially conservative about leaving enough room and time to return. The water may be rising faster later in the visit or waves may reach the route even before the water level alone would cover it.
If you see observed data and predictions on the same station page, check the legend. A measured level represents conditions that the instrument recorded. A prediction describes the expected level for a time and place. They can differ. Verify which series you are reading before quoting a number or trying to explain how today compares with yesterday.
Use a separate table for current
A current describes how water moves. The Canadian Hydrographic Service current tables give predicted times of slack water and times and speeds of maximum currents at particular locations. For Seymour Narrows, look at station 08108’s current page. Use its headings and legend to understand the direction, speed and time in the table. Those values concern the current station. A different channel or shoreline can experience different movement. Canadian Hydrographic Service current station directory
Slack water is the period associated with a change in direction when the current is weak at the specified location. Its predicted time does not automatically coincide with high or low water at the Campbell River tide station. The time of maximum current answers another question again. If a plan depends on current, look up the current prediction directly. Do not infer safe conditions from the nearest high or low tide entry.
A shore observer can often see clues to water movement, such as drifting foam or a boundary between smoother and rougher water. Those observations may help explain what is happening nearby. They cannot provide a reliable measurement across the channel or through the full depth. If you are boating, use the appropriate Canadian Tide and Current Tables, charts and local marine information for the route. Leave vessel decisions to the crew on a guided trip.
Build a simple plan for a shoreline stop
Choose the place first. At a viewpoint with a path or benches, you may want a look at Discovery Passage whatever the tide. If the visit is specifically about seeing exposed shoreline, compare the lower tide times with your schedule and the conditions. Plan to reach the viewpoint early enough to watch the water before deciding how far to go. If your group includes people who prefer to stay on a paved path, pick a stop that works even if the shore is wet or rough.
Then decide what would change your plan. An unexpectedly high reach of waves, slippery footing or poor visibility may be enough reason to stay back. If the tide is rising, make the return route part of the decision from the beginning. If the shore visit is one stop in a full day, set a time to leave so you can reach your next activity comfortably. Eagle Eye’s guide to things to do in Campbell River
If you share the plan, include the practical interpretation as well as the number. For example, say that you intend to look from the path near the predicted low and will decide at the site whether there is a suitable place to go lower. Your companion then knows the time and the purpose. They also know where to meet if part of the group wants to remain on the path.
Keep tide planning separate from tour check-in
A marine wildlife tour has a departure and meeting time set by the operator. If you also want to make a low-tide stop, schedule it before or after that fixed commitment with enough time to travel and change layers. A prediction is useful for arranging your time ashore. It does not tell you which route the crew will take or what wildlife you will see. Ask how local current and weather influence the crew’s choices if you want to understand the passage better. Eagle Eye’s Campbell River marine wildlife tour
You can also use two visits to see how the waterfront looks at different levels. Compare the same landmark and write down the station, time and weather for each visit. One view may show more beach, while the other puts the water close to the edge of the path or rocks. Keeping your observations beside the predictions gives you a clearer sense of what the figures mean for that particular place.
Save the station link rather than only a screenshot of the chart. The link lets you reopen the table for a changed date and check the headings again. If you keep a screenshot for use offline, include the top of the page with the station, date and time zone. A cropped curve can be hard to interpret when you no longer remember which day it shows.
Frequently asked questions
What tide station should I use for Campbell River?
The Canadian Hydrographic Service lists Campbell River as station 08074. Check the map and station information if your destination is outside the city waterfront or your plan depends on a different location.
Is a low tide the same as slack water?
Low tide refers to a predicted low water level at a tide station. Slack water concerns current at a current station. Check the separate current prediction when the movement of water is the issue.
Does a lower number mean I can walk farther on the beach?
It may mean that more of the beach is exposed. The shape of the shore, wave action, footing and route back matter. Use the prediction to plan the time, then make the decision at the site.
Can a tide table tell me when I will see whales?
It describes water levels at a station. Wildlife sightings depend on where the animals are and the conditions in which people are watching. Choose a guided departure using the operator’s trip information and treat the tide as context for the day.