
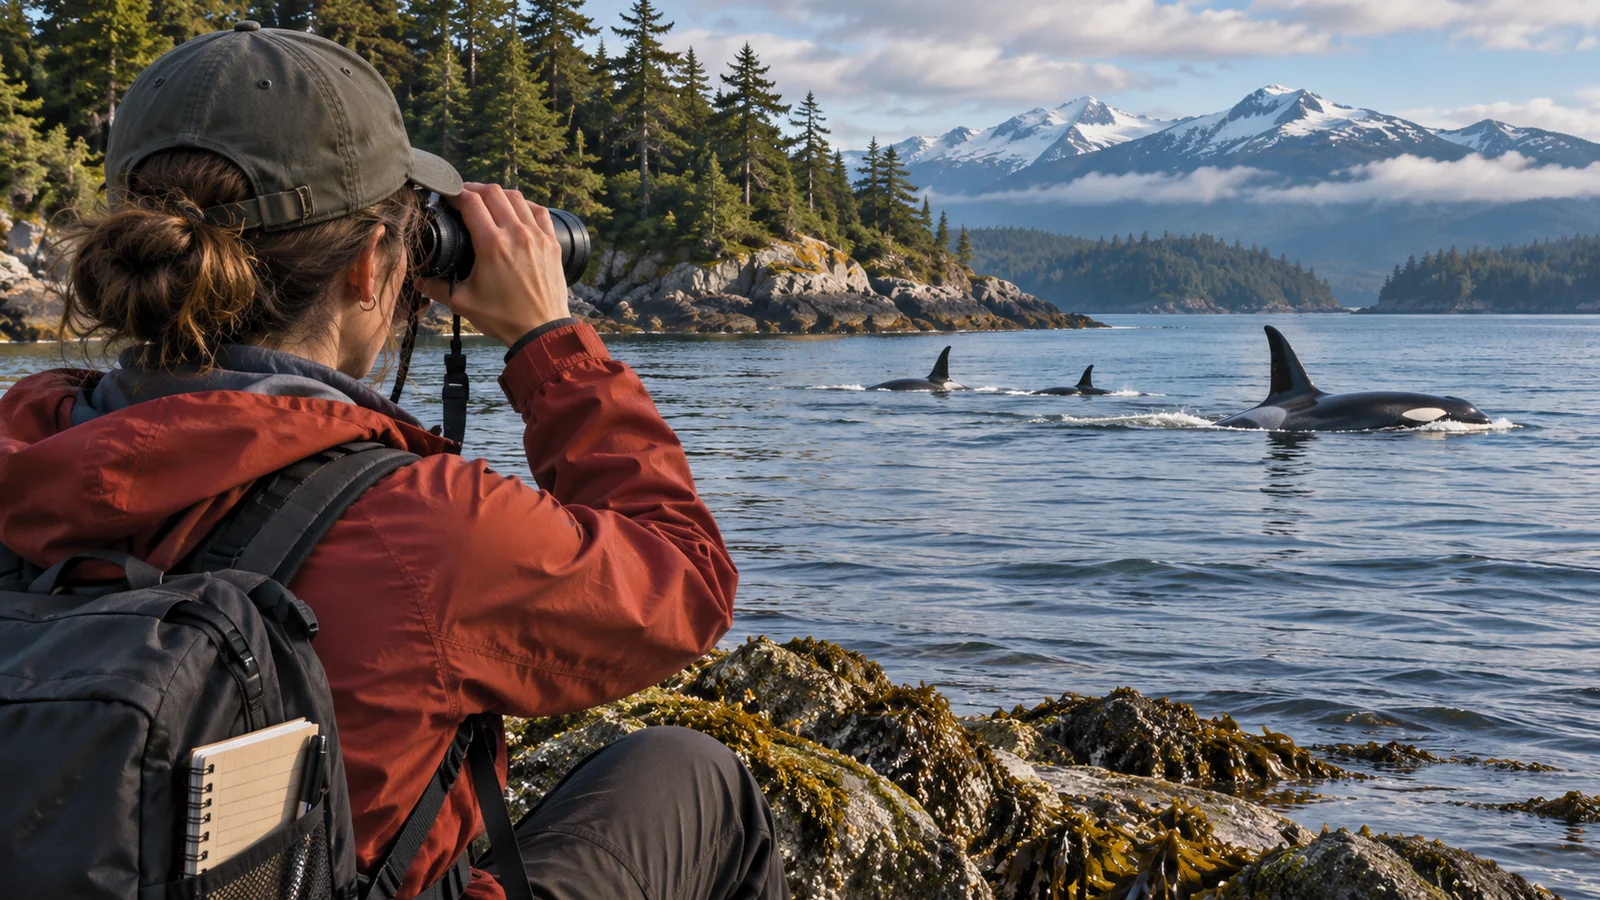
Researchers count killer whales by recognising individuals, recording them across encounters and checking which animals are likely to have been missed. A well-studied population can sometimes be counted through repeated identification of known whales. For harder-to-observe groups, researchers may use statistical models to estimate the number present. A report of six fins from one boat tells you something different. It describes a particular encounter, while a population count combines evidence from a defined place, time and group. To understand a published number, check which population was counted, when the work was done and how the researchers handled incomplete coverage. Canadian killer whale status assessment
Start with a population, a place and a period
The word population can sound as though it means every killer whale in an area. In a scientific report it usually refers to a group defined using evidence about animals and their relationships. Northern and Southern Residents, for example, are distinct populations even though their geographic ranges overlap. A count of Southern Residents does not include every orca observed in the Salish Sea. Before comparing numbers, find the definition of the group the researchers set out to count. Canadian resident recovery strategy
Check the study area and the period as well. Researchers may focus on a coastal subset of a wider population or report a count at a particular point in the year. The number can change when births and deaths are recorded. It can also change when a new study includes a different part of the range or revises the set of whales it was able to identify. A bigger figure in a later document does not establish population growth unless the groups and methods are comparable.
A useful habit is to keep the label with the number when you take notes. Include the population or subset, the date and whether the source gives a census, an estimate or a minimum count. That way you can tell whether two figures refer to the same question. A number on its own is difficult to check later, even if it was accurately copied. Save the source and table title.
Turn photographs into individual encounter records
Researchers photograph features such as the dorsal fin and the light saddle patch behind it. They compare the shapes, marks and patterns with a catalogue of known whales. Several photographs can be useful when an angle hides a feature or the water covers part of the body. The match depends on how clearly the marks are visible and whether the researcher has suitable earlier images for comparison. OrcaLab photo-identification methods
Once an animal is identified, the observer can record when and where it appeared and which other whales were present. The same animal may be photographed on several days and by more than one team. Matching the records keeps one whale from being added to a population total every time it surfaces or moves to a new place. A catalogue gives researchers a way to connect those encounters without assuming that two animals seen in similar water are the same individual. DFO Bigg’s killer whale photo catalogue
A count of individuals visible together still matters. If you see four fins at the same time, that gives you a minimum number for that view. The challenge comes when the fins appear one after another or some of the group is out of sight. Researchers can use images and time notes to decide whether the same animal was seen again. In a brief encounter, it is more accurate to keep a minimum count than to add every surfacing.
When researchers can make a census of known whales
A census aims to account for the individuals in a defined population. For well-studied resident groups, long records of family associations and individual photographs help researchers follow which animals are present. They can note new calves, compare later sightings and investigate gaps in the record. The Canadian status assessment describes annual photographic coverage of the Southern Resident population and notes that not every Northern Resident is seen in some years.
The difference between those examples shows why knowing many individual whales does not remove every uncertainty. Some groups may travel outside the area where researchers can work. Weather can prevent surveys. Photographs may show some but not all members of a family. A whale that has not yet been photographed during a survey period may be alive elsewhere. Researchers use later observations and the history of the animal to assess what the absence means.
When you read about a missing whale, look for the language the researchers used. “Not seen this year,” “presumed dead” and “confirmed dead” describe different levels or kinds of evidence. A long gap in the observations can become meaningful when a group has been checked repeatedly. A single missed encounter is much weaker evidence. This matters when interpreting changes in a count from year to year.
How an estimate accounts for animals that were missed
Researchers may not be able to see and identify all members of a population in a survey. In that situation, a count of unique animals observed gives useful information, but it may be below the actual total. A statistical estimate uses observations and assumptions to describe how many whales could be present. The Canadian assessment describes use of annual photo-identification histories to estimate abundance for offshore killer whales.
One broad approach is called mark-recapture. Here the natural markings on a whale can make it recognisable, so the researchers can record an encounter with an individual without physically marking it. Finding the same animal again gives information about how frequently observed whales are encountered. If many identified individuals are seen repeatedly, the pattern can be different from one in which most observations are of animals seen only once. The model uses the records and its assumptions to estimate what may have gone undetected.
An estimate needs to be read with its uncertainty. A report may give a central value with a range or other measure of precision. That range reflects the data and model used. It does not mean every value inside it is equally likely. When comparing two estimates, consider whether the uncertainty is large relative to the difference and whether the researchers used similar methods. A careful comparison often begins with the captions and methods rather than the biggest numbers in the report.
Why survey effort can change what you see in the data
Imagine two field teams working in different parts of the coast. One has good weather and can photograph groups on most days. The other has several days when the water is difficult to work in. A larger number of sightings by the first team may reflect where the whales were, the effort the team could put in, or both. Researchers record survey effort to help interpret what their observations mean.
The same question applies to sightings shared by visitors. More people watching from a popular viewpoint can produce more records. A quiet week at that viewpoint may reflect conditions, animal movement or fewer people watching. Public reports can be useful observations, particularly when they include clear details. They are harder to use as a simple count of the entire population. Check how the study accounted for places and times where no comparable observations were made.
An acoustic record can help detect whales that were not seen. If researchers recognise calls from a known population, they may gain evidence about its presence in an area. The recording will not necessarily tell them how many whales were present or which ones were calling. Photographs, sound and survey logs each contribute something different. Combining them can make a stronger account than treating every detection as another individual.
Work through a simple example
Suppose you photograph three whales on Monday and four on Tuesday. On Tuesday, two of the whales match Monday's photographs. The two encounters therefore provide five distinct identified whales, even though you counted seven appearances across the days. If a sixth animal was briefly seen but never photographed clearly, you can record that observation separately. You would need more information to decide whether it was another animal or one already in the catalogue.
Now imagine researchers follow that process for a defined population over years. They can link the records to known families, review whether an animal has been seen recently and describe changes in membership. Some years they may have stronger coverage than others. The example explains why a published total is a result of the comparisons the researchers could make, rather than the sum of the numbers written down during each encounter.
Keep three kinds of numbers separate
A unique-individual count answers “How many distinct whales did the team identify?” It can be a strong result when the team has photographed the relevant individuals and checked for duplicates. The number tells you what was documented. If the coverage was incomplete, it can leave open how many animals were not seen. Read any notes about whether the total includes whales with uncertain identifications.
A population estimate answers a wider question about how many individuals were likely present. It may use the record of known whales as input. If a report includes both numbers, keep them separate. The observed minimum is not the same as the estimated total, and the estimate may be accompanied by a measure of uncertainty. When sharing the figures, say which kind you are using.
A trend answers whether comparable counts or estimates show a change over time. It is a result of comparisons, so the dates and methods matter. A series from the same programme can be easier to interpret than a collection of figures gathered with different definitions. If a series changes method partway through, read how the researchers handled the transition. The best comparison may be within the periods that were measured in the same way.
Frequently asked questions
Can scientists count every killer whale in British Columbia at once?
The animals move over wide areas, and different populations and ecotypes use some of the same waters. Researchers use methods suited to the population they study. A total for one group should be read with the area, date and counting method that produced it.
Why is a photograph worth more than another sighting total?
A clear photograph can help link an encounter to a known individual, which is useful for comparing records and avoiding double counting. A sighting total is still useful when it describes how many animals were visible. The two observations answer different questions.
Does a higher number mean the whales are recovering?
It can be evidence of growth when the figures are for the same population and are comparable over time. A change in the study area, coverage or estimate can also affect the number. Check the study's interpretation and look for a trend across several years rather than assuming a difference between two totals means recovery.
What can I record on a tour?
Note the time, general location and how many animals you could distinguish at once. Keep original photographs if the crew allows you to take them from your viewing position. Ask which individuals the guide can recognise and which remain unknown. Follow the crew's directions and keep the focus on observing the whales from the position they provide. Eagle Eye Campbell River orca guide · DFO wildlife viewing guidance
On a Campbell River whale watching trip, ask how the guide would tell whether the whales surfacing now are the same animals seen a few minutes ago. That small comparison is the beginning of the work that makes a population record possible. Eagle Eye six-hour whale watching tour